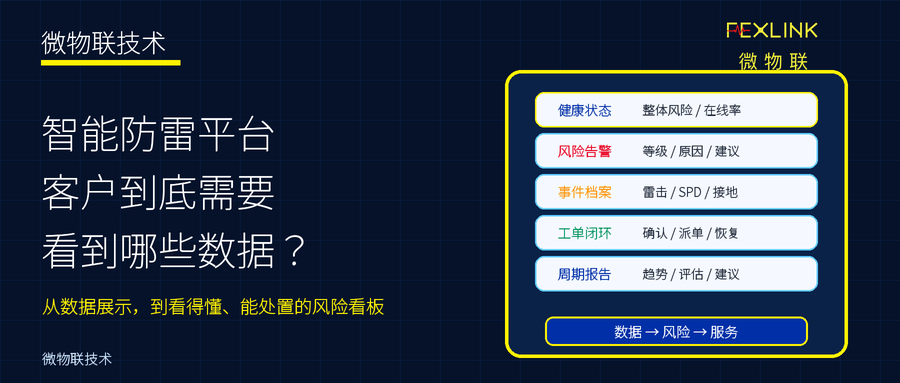
Cover image of public account: From data display to risk dashboard
Abstract: The value of the intelligent lightning protection platform does not lie in stacking all sensor data on one interface, but in helping customers understand the operating status of the lightning protection system. A truly useful platform should be able to answer: Which points are normal, which points are abnormal, which alarms are important, which equipment needs to be reviewed, whether lightning strikes or surge events have occurred, whether the SPD has deteriorated, whether the grounding status has changed, whether the processing is closed loop, and whether periodic reports can be formed. What customers need is not complex curves, but risk management dashboards that are understandable, traceable, manageable, and traceable.
After many smart lightning protection projects are completed, there is indeed a lot of data on the platform: equipment online status, SPD status, leakage current, temperature, ground resistance, number of lightning strikes, lightning current peak, alarm records and trend curves.
But after customers open the platform, what they really care about is not each number itself, but: Is it safe here? What's wrong? Is it unusually serious? Why is it abnormal? Do you want to deal with it immediately? Who will handle it? Finished? Will it relapse next month?
Therefore, the intelligent lightning protection platform cannot be just a data display system, but should become a risk interpretation and operation and maintenance decision-making system. The platform should organize lightning current, SPD, grounding, leakage current, temperature, equipment online, alarms, work orders and reports into a risk management view that customers can understand, make decisions and trace back.
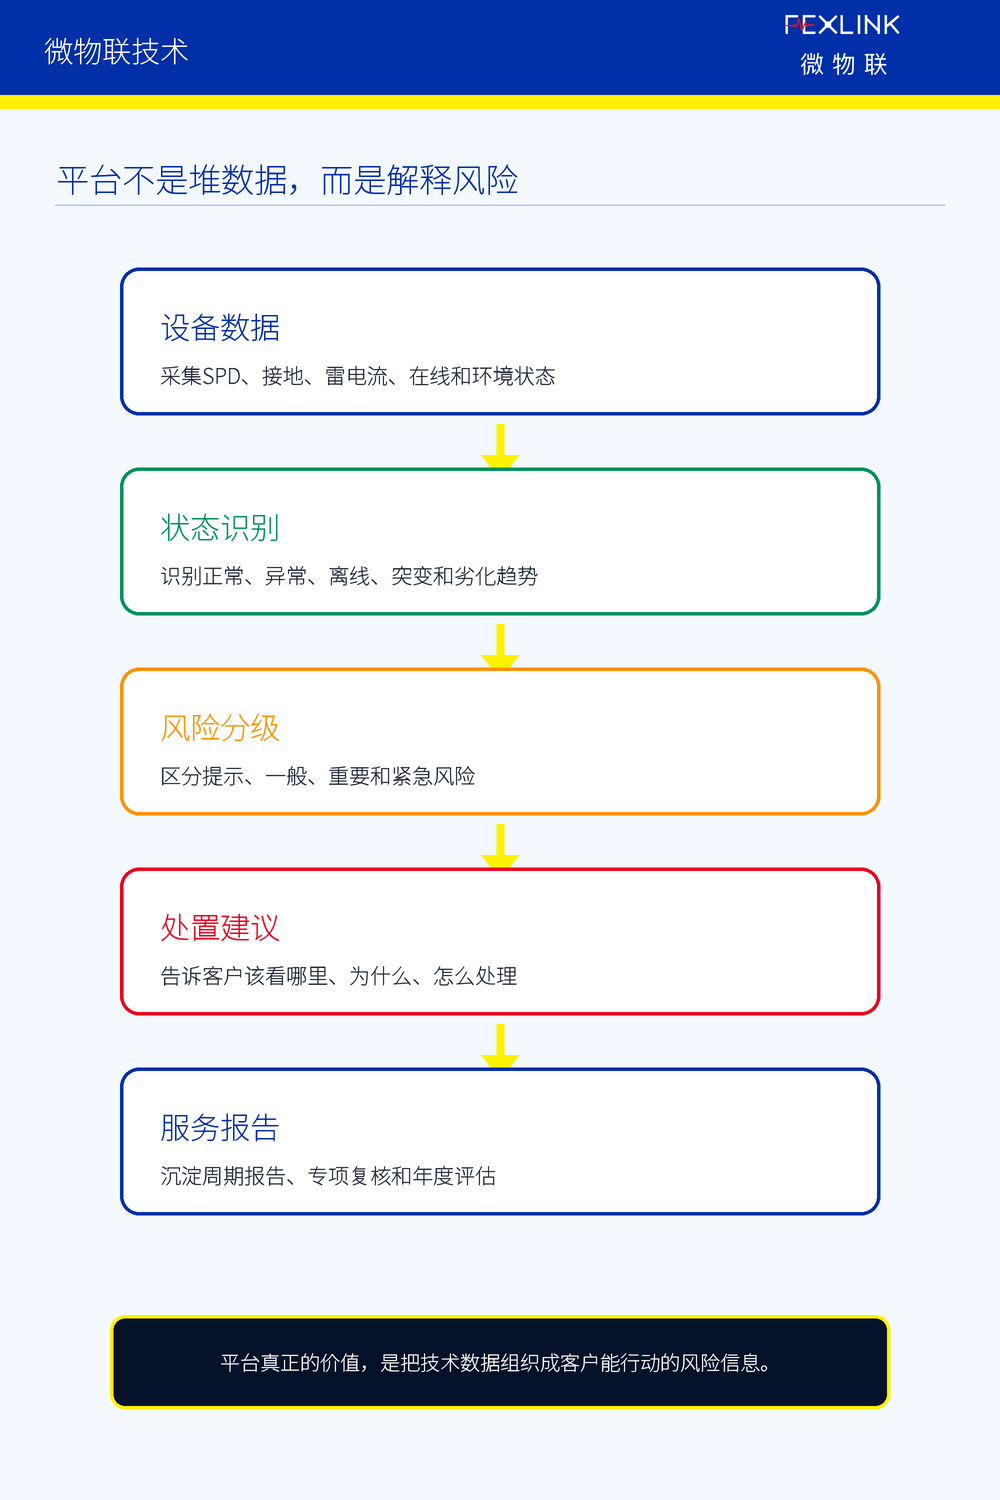
1. The platform must first answer the five questions that customers are most concerned about.
First, is it currently safe? When customers open the platform at first glance, they should not see complex parameters first, but should see the overall status, risk level, abnormal number, important alarms, offline equipment and pending work orders. The homepage of the platform should be like a "Thunder Protection Health Overview".
Second, where are the risks? The platform must have point-based and regional capabilities and be able to tell customers which distribution cabinet has an abnormal SPD, which grounding point has increased ground resistance, which site has a lightning current event, which lightning protection box is offline, and which area where alarms occur repeatedly.
Third, how serious the risk is. Not all alerts are the same. If the equipment is offline for a short period of time, it may be at the prompt level. If the SPD remote signaling is abnormal, it may be at the general level. If the SPD leakage current continues to increase, it may be at the important level. A sudden grounding change after a strong lightning strike may be at the emergency level. Having more alarms does not mean that the platform is strong. Only when important risks can be seen first can they be valuable.
Fourth, why the police were called. After customers see the alarm, they should not only see "SPD abnormality", "ground abnormality" and "equipment offline", but also the triggering reasons: continuous increase in leakage current, temperature exceeding the threshold, state mutation after lightning strike, rising ground resistance trend, equipment offline for more than the set time, or multiple abnormalities in the same area.
Fifth, has it been processed? All alarms will eventually enter a closed loop. The platform should display whether the order is confirmed, whether the order is dispatched, who is responsible, whether the order is present, whether the equipment is replaced, whether it is restored to normal, and whether it is archived. Otherwise, the platform only discovers problems but does not manage them.
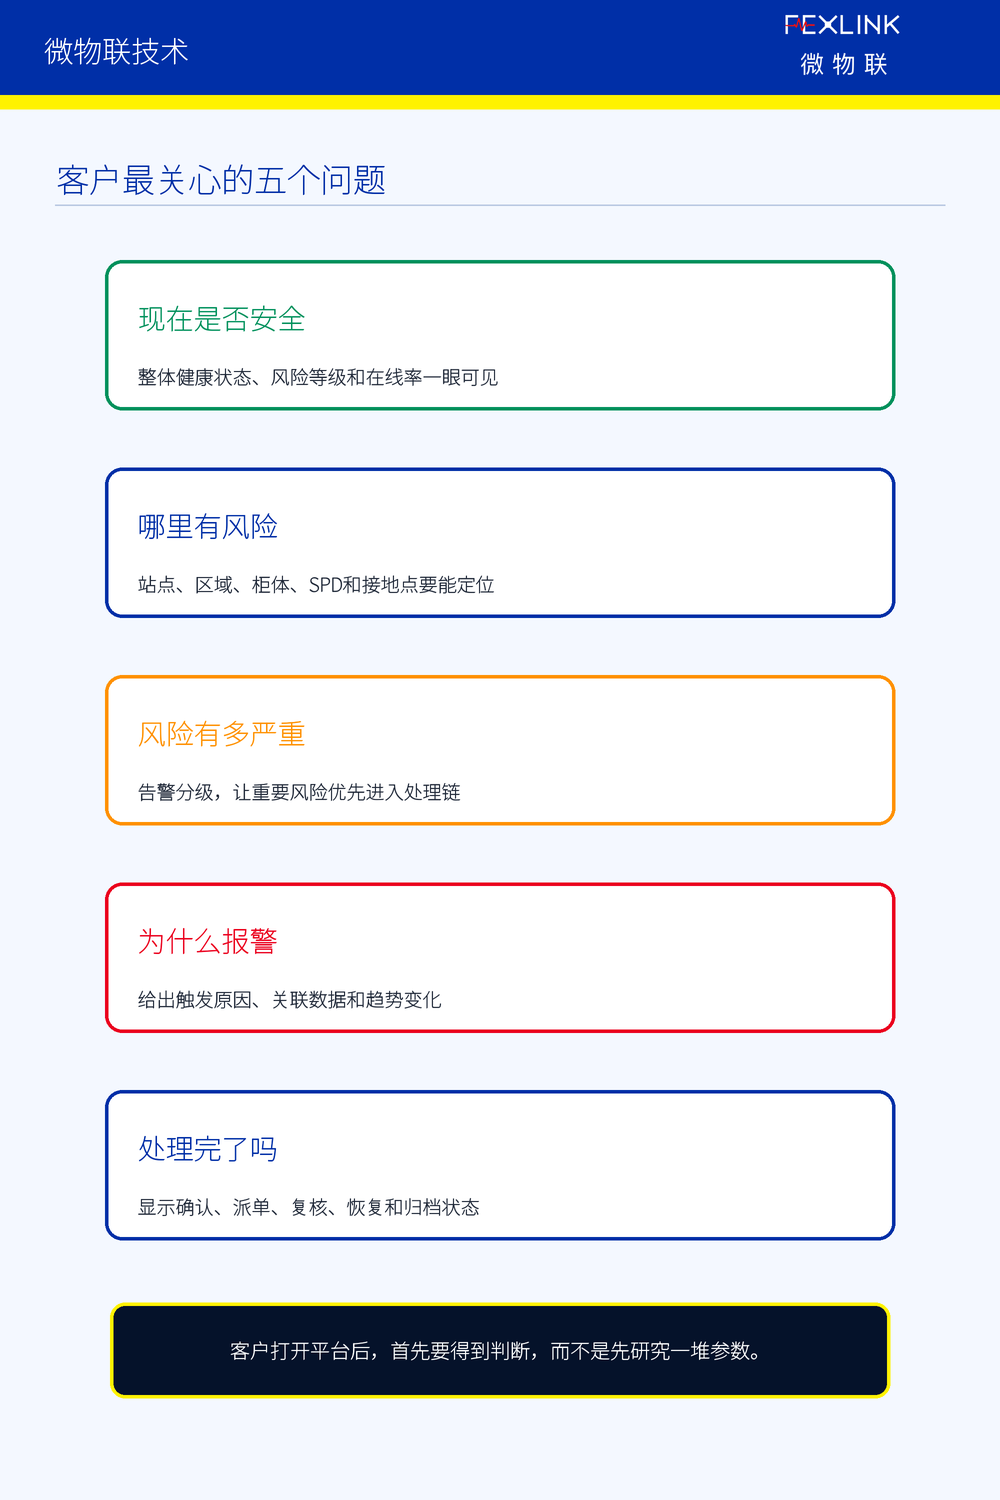
2. How should the platform homepage be designed?
The homepage of the platform should not be filled with curves, but should first help customers quickly establish an overall judgment. The first layer of the homepage is the overall health status, including system health score, risk level, online rate, number of abnormal points, and number of pending work orders. Customers can know the status of the entire lightning protection system at first glance.
The second layer of the homepage is key risk reminders, including emergency alarms, important alarms, abnormalities after lightning strikes, sudden grounding changes, SPD degradation, and equipment offline timeout. The point is not to exclude all alarms, but to allow customers to prioritize the issues that should be dealt with.
The third layer of the home page is a station or area map. Parks, computer rooms, wind farms, photovoltaic power plants, communication base stations, oil and gas storage tank farms, highways and railways all require maps or hierarchical structures to locate risks. The map is not a decoration, but is used to place risks on site.
The homepage should also display today's events and recent trends, such as today's lightning current events, today's SPD alarms, today's grounding anomalies, risk trends in the past 7 days, and alarm changes in the past 30 days. Finally, the home page should display to-do and work order status, directly connecting to long-term operation and maintenance services.
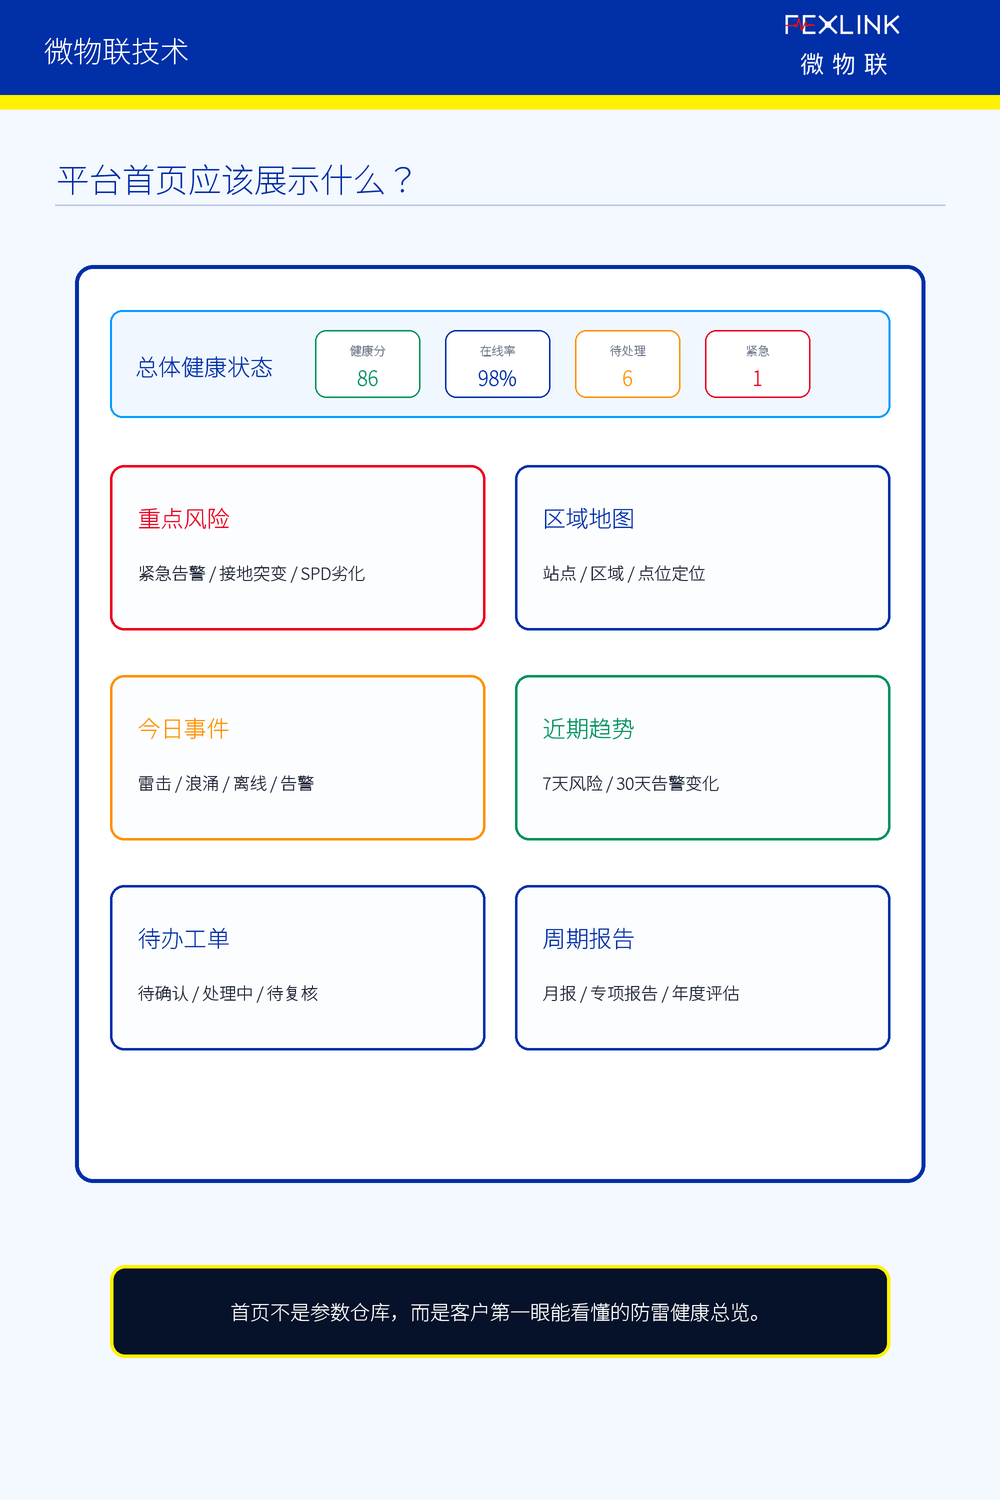
3. The alarm page cannot only display a red prompt.
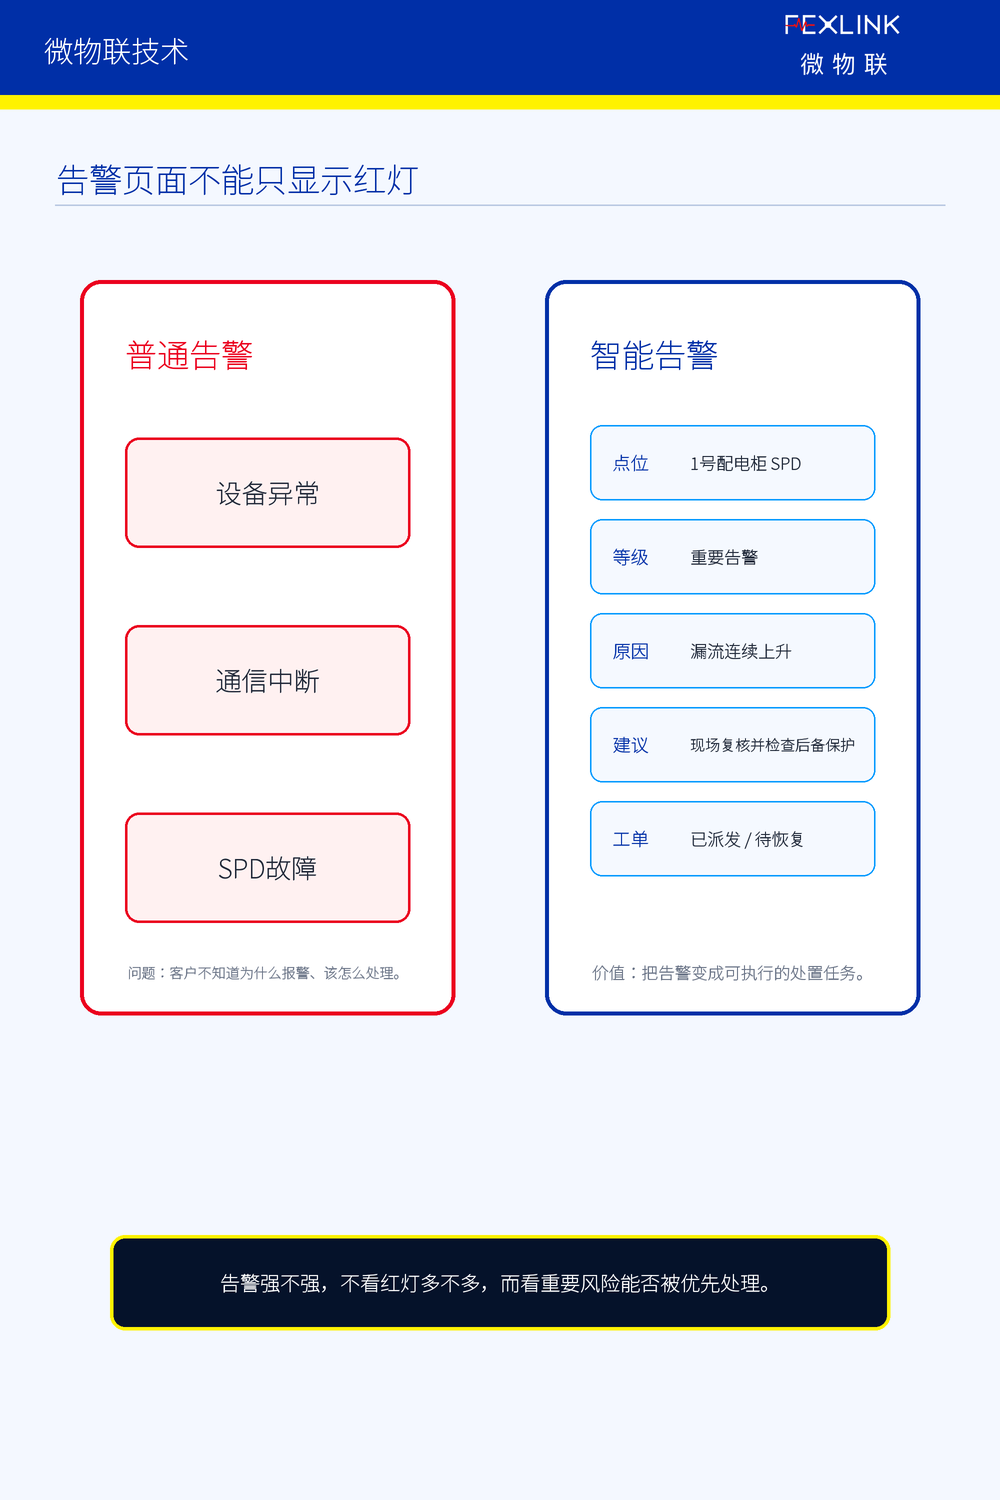
The problem with many platforms is that the alarms are too simple, only displaying "equipment abnormality", "SPD failure", "grounding abnormality" and "communication interruption". Customers often don’t know what to do after reading it. The alarm page should be upgraded from "red light reminder" to "disposal entrance".
A truly valuable alarm should at least include the alarm point, alarm level, trigger cause, associated data, recommended actions, responsible person, processing period and historical records. For example, an SPD alarm should not only display a fault, but should indicate whether it is a remote signaling trip, an increase in leakage current, an abnormal temperature, or a state change after a lightning strike.
Alarms also need to support correlation judgment. For example, when lightning current events, SPD status changes, ground resistance mutations, and device communication abnormalities occur at the same time, the risk level of this event is significantly higher than that of a single device going offline. The platform should be able to identify risk chains rather than display each alarm in isolation.
It is best to give suggestions for handling the alarm, such as on-site inspection of the SPD module status, review of the grounding connection point, check of the backup protection status, checking whether the equipment in the same area is synchronized abnormally, and special review after a thunderstorm. In this way, the platform becomes more like an operation and maintenance assistant rather than an alarm.
4. What should you look for on the trend page?
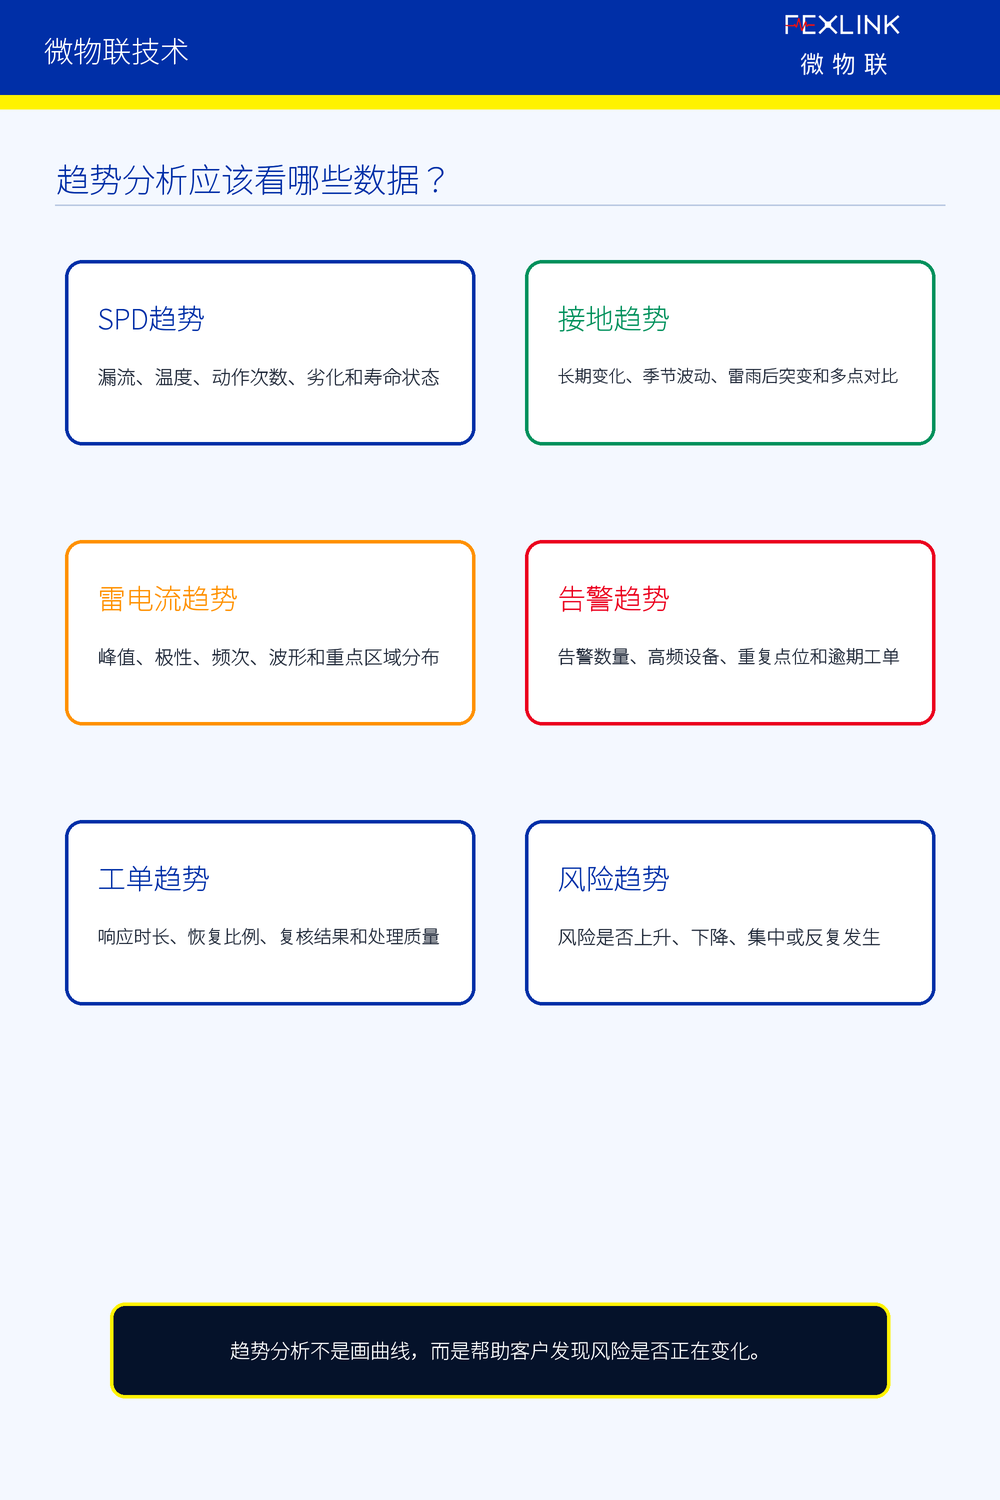
The SPD trend focuses on leakage flow trend, temperature trend, number of actions, deterioration trend and life status. The risk of lightning arresters usually does not appear suddenly. In many cases, the leakage current gradually increases, the temperature continues to be high, and the life span decreases after multiple impacts. The trend page should help customers see this process.
The grounding trend focuses on long-term changes in grounding resistance, seasonal changes, sudden changes after thunderstorms, multi-point comparison and abnormal recovery. The grounding system is not always reliable once it passes the test. Soil, corrosion, construction and lightning strikes will all cause changes in the grounding status.
The trend of lightning current events focuses on lightning strike time, peak size, polarity, frequency, waveform, multiple impacts and distribution of key areas. This part can help customers determine which areas have frequent lightning strikes, which points need to be protected, and which events require special review after thunderstorms.
Alarm trends and work order trends serve managers. The platform should be able to see changes in the number of alarms, high-frequency alarm equipment, repeated alarm points, overdue work orders, recovery ratio and average response time. The purpose of trend analysis is not to draw a curve, but to determine whether risks are improving or worsening.
5. What should be recorded in the event file?
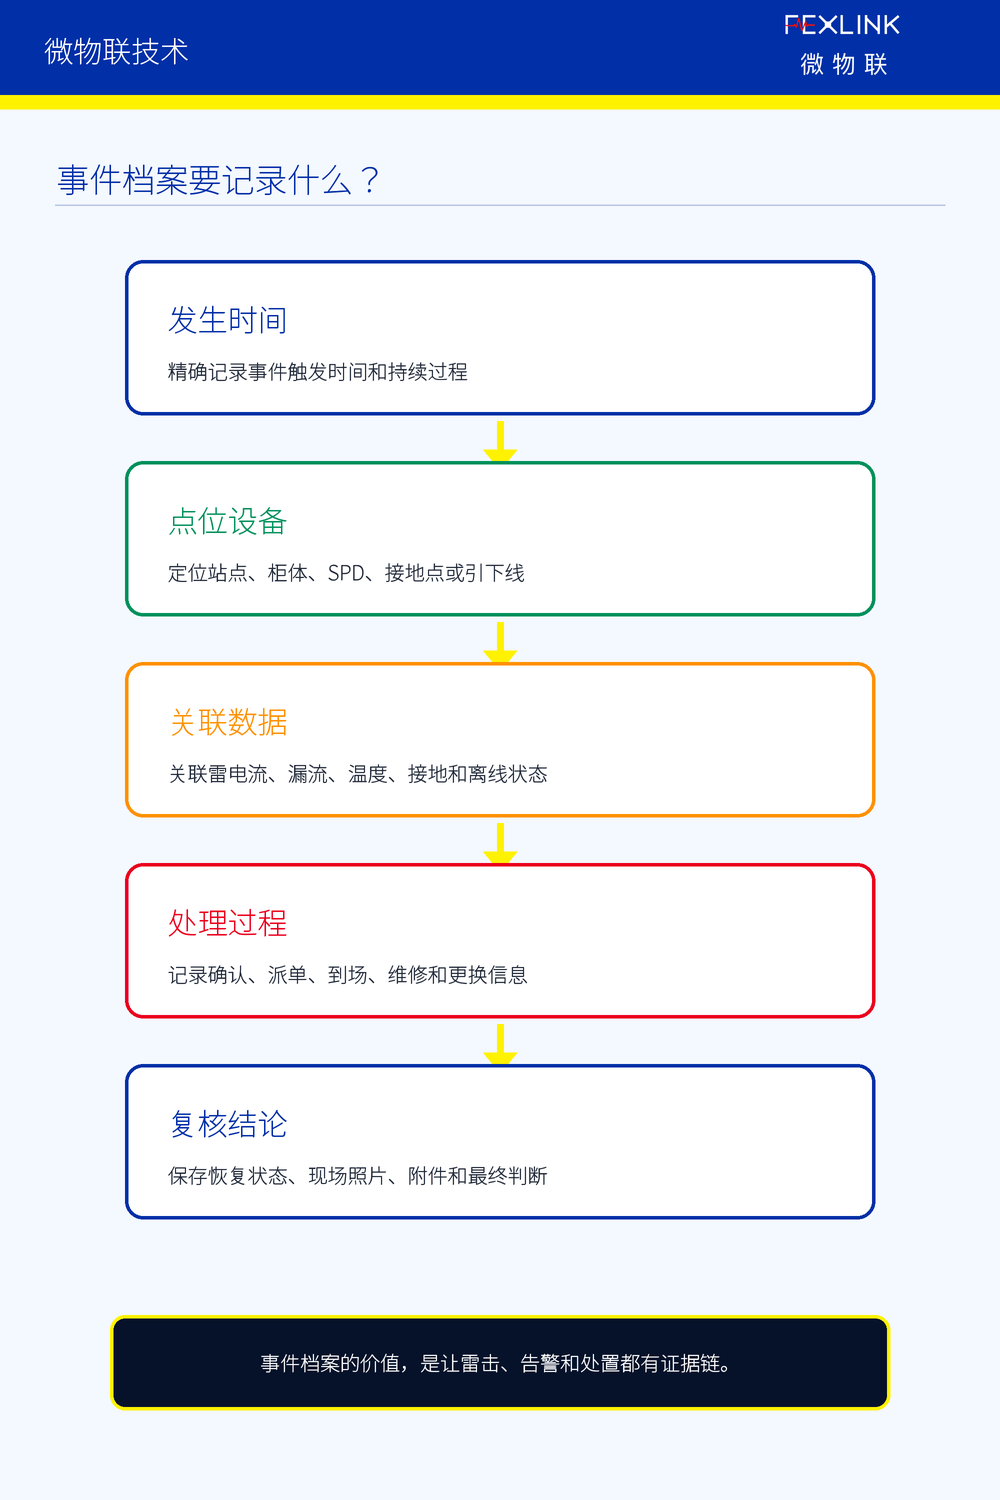
The intelligent lightning protection platform should establish files for every important event, especially lightning strikes, strong surges, SPD abnormalities, grounding mutations, equipment damage and post-thunderstorm review events. Without files, the platform can only prove that "the police have been called"; with files, the platform can form an "event evidence chain."
The event file should include event number, occurrence time, occurrence point, event type, peak or status value, associated equipment, associated alarms, processing process, processing results, review records, pictures or attachments, and final conclusion.
For customers, incident files can be used for accident review, responsibility judgment, annual evaluation, customer reporting and subsequent rectification. For service providers, event files can prove service quality and can also accumulate long-term data assets.
6. How does the platform support long-term services?
The intelligent lightning protection platform must be able to support long-term service and not only be displayed during project acceptance. The platform must be able to generate monthly lightning protection health reports, quarterly trend analysis reports, special review reports after thunderstorms, annual risk assessment reports, lists of rectification suggestions, and equipment replacement suggestions.
The report cannot just export a data table, but should answer the questions that customers really care about: which points have increased risks, which systems are stable in the long term, which SPDs need to be replaced, which grounding points need to be reviewed, which alarms reoccur, which work orders are handled in a timely manner, and what is recommended in the next stage.
This just follows the logic of intelligent lightning protection services: the platform is the entrance to long-term services, data is the basis for services, reports are deliverables that customers can perceive, and the closed loop of work orders is evidence that risks are truly handled.
7. How does FEXLINK understand the intelligent lightning protection platform?
MicroIoT believes that the intelligent lightning protection platform is not a display screen after the equipment is connected to the Internet, but the entrance for lightning protection data to enter the customer safety management process. The value of the platform does not lie in the amount of data, but in whether customers can understand the status, judge risks, and promote disposal and precipitation reports from the data.
FEXLINK focuses on: whether the status can be understood at a glance, whether risks are automatically classified, whether events can be traced, whether trends can be explained, whether work orders can be closed-loop, and whether reports can be continuously output.
It can be summarized as three changes: from data display to risk explanation; from alarm accumulation to hierarchical processing; from platform pages to long-term service portals.
Conclusion: What customers need is understandable and actionable risk information.
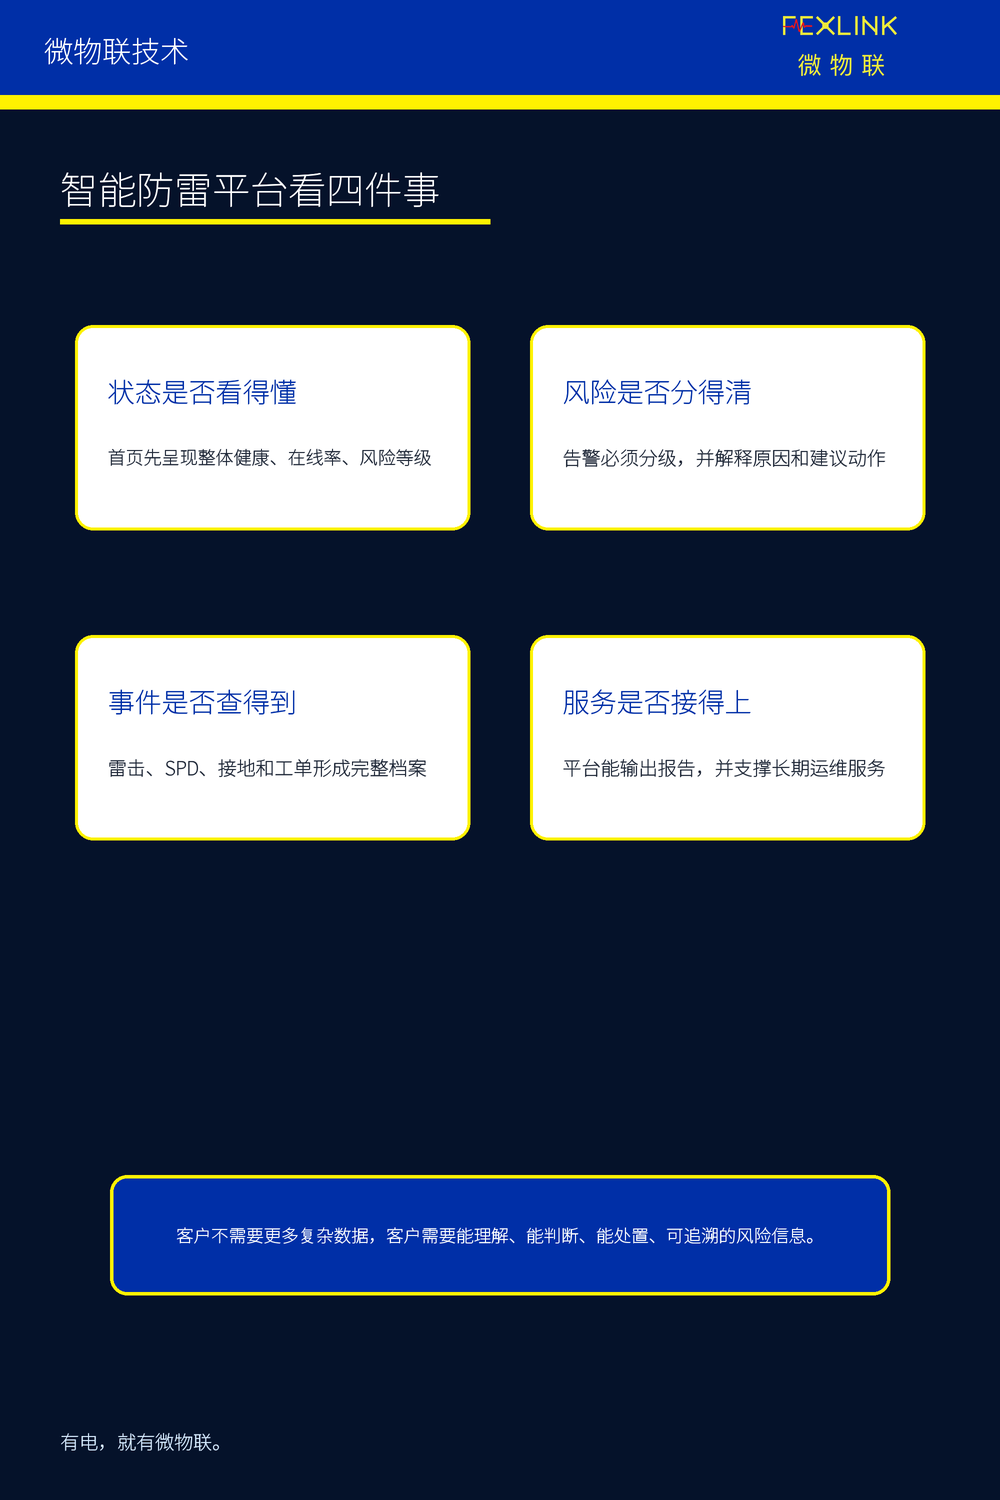
What the intelligent lightning protection platform should really show customers is not the more parameters, the better, nor the more complex and professional curves, but risk information that customers can understand and act on.
Customers need to know: where is normal, where is abnormal, where is the most urgent, why is abnormal, who is handling it, what is the result, and what to do next. Only when the platform can answer these questions can intelligent lightning protection data truly transform from device data into management value.
FEXLINK technology will continue to share content related to intelligent lightning protection, early warning of electrical safety, digital power distribution, energy supervision and industrial Internet of Things.
FEXLINK/FEXLINK uses data to reconstruct energy efficiency and electrical safety.
Where there is electricity, there is FEXLINK.